Today’s summary plot shows we have been successful getting data from the mountain over a period of two years. This is the simple on-board temperature but it shows that the network is ready for deployments with more real-world sensors!
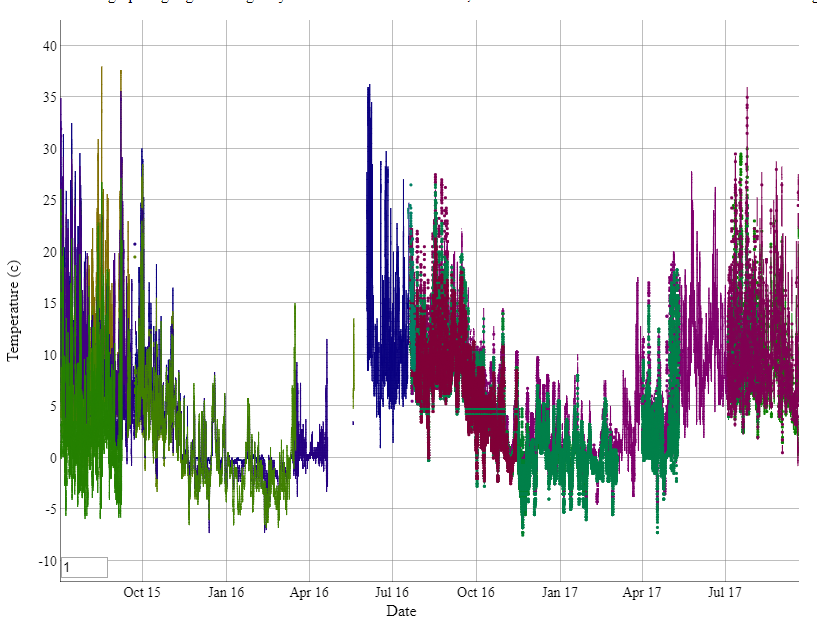
This is the long-term plot of temperatures obtained onboard the sensor nodes, It shows that data has been obtained almost continuously since summer 2015.