What did we learn?

We set out to prove that environmental sensor networks could be built using modern internet standards rather than temporary home-made solutions which become incompatible in the future. Our use of the latest internet protocols: IPv6 (as 6LoWPAN), CoAP (rather than HTTP), standard radio frequencies (868 MHz), low power radio protocols etc really could build reliable sensor networks. The significance is that future sensing systems could be linked together and expanded much more easily than before.

These technologies could lead to having many types of sensors made by different people – all sharing the same low power network. Study areas of many tens of square kilometers with several research groups could work separately while benefiting from the low power network. CoAP also helps to unify sensor systems with the web so URLs can be used rather than custom addresses.

We look forward to building larger earth science sensing systems in the future!

Lochan node starts to recharge after the winter

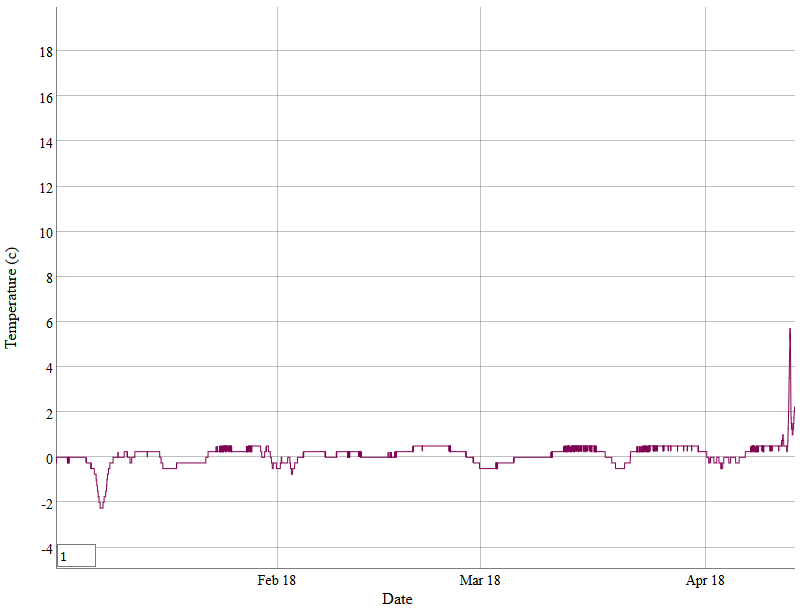
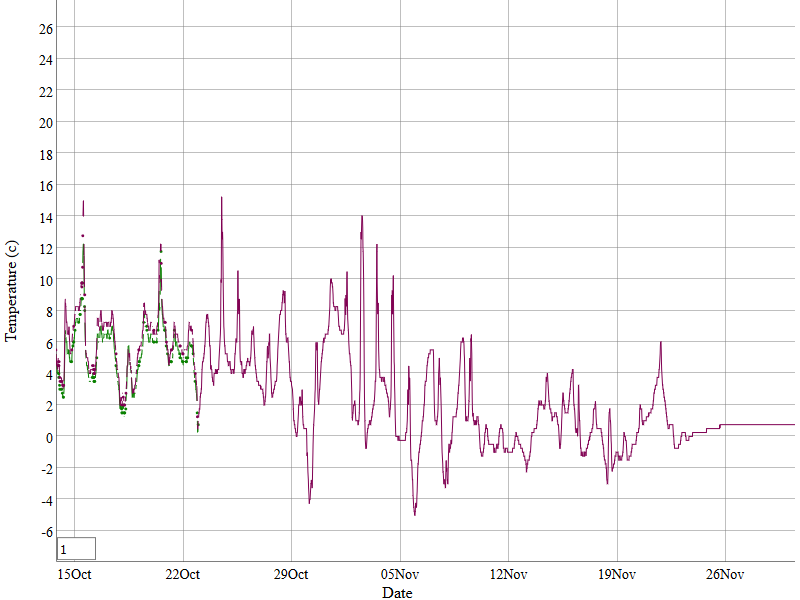
This temperature plot for the lochan node shows that the snow – which was covering the solar panel has melted. This allowed the battery to charge again. The snow acts as an insulation layer to the Peli box – which is why the temperatures show little daily change before.

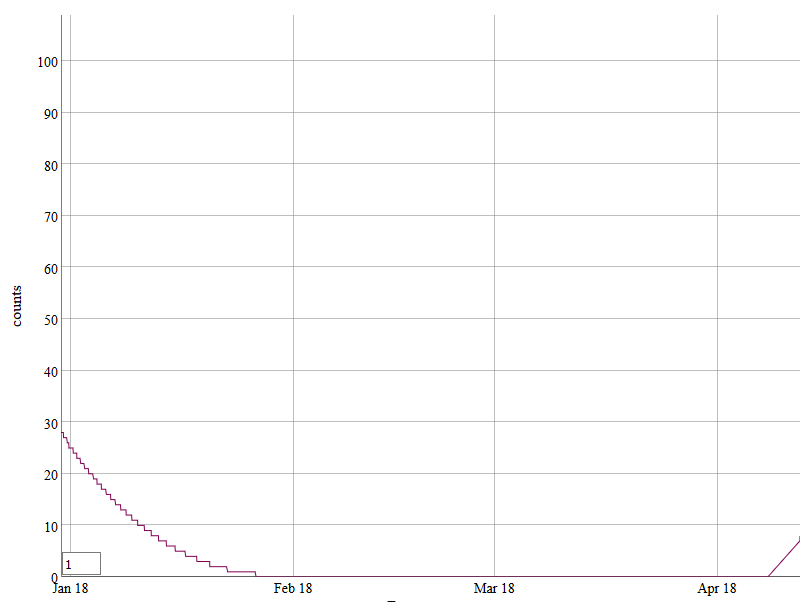
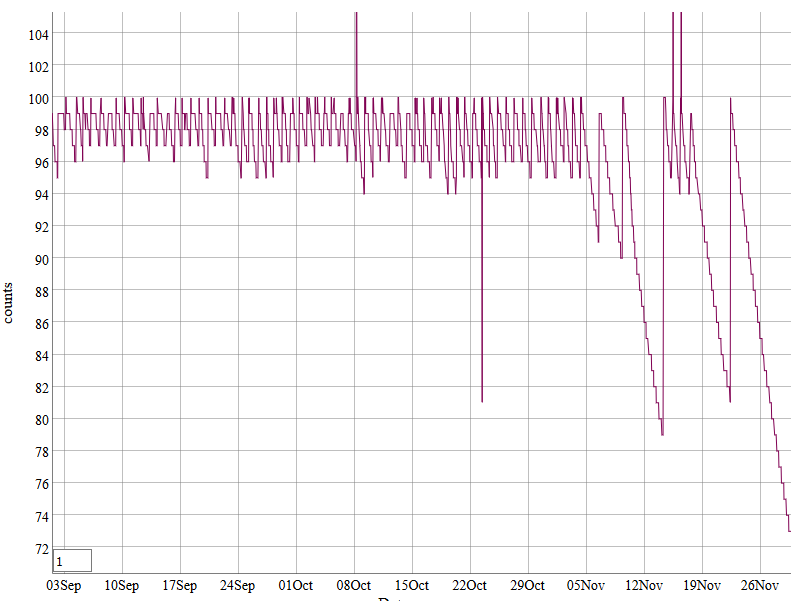
This plot of the Starte-of-Charge data for the lochan node shows that now the snow has melted off the solar panel it has begun to recharge. There was a slight error in the zero level as the node worked for part of that period.

This data shows that Sebastian Bader’s smart-charger has worked well and the lithium ion battery has performed as expected throughout the winter.

View of the mountains from the A9 in spring

view of the mountains with the test sites – 13km away as viewed from the A9 road in March 2018. On the left a snow-filled track can be seen. Also snow covering the slopes towards the centre where the Lochan node is still functioning. Click on the image to see the full-size

Lochan node into 2018

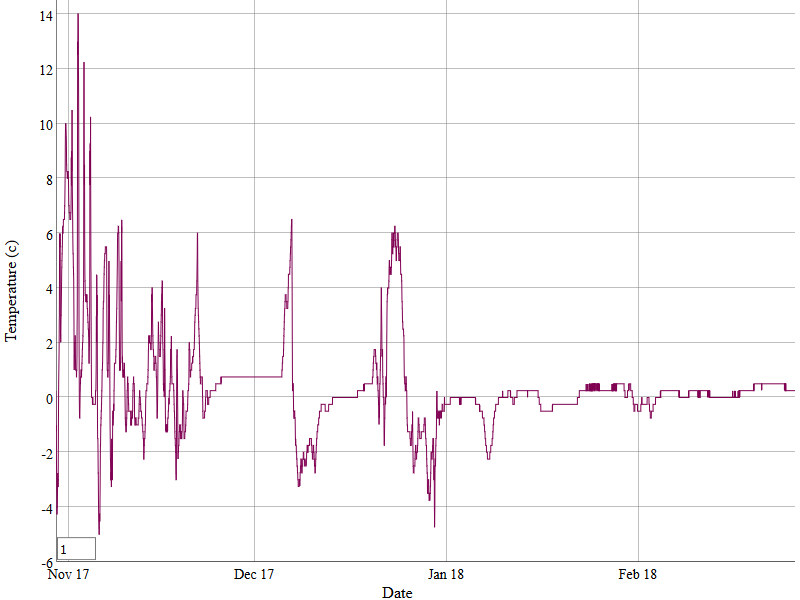
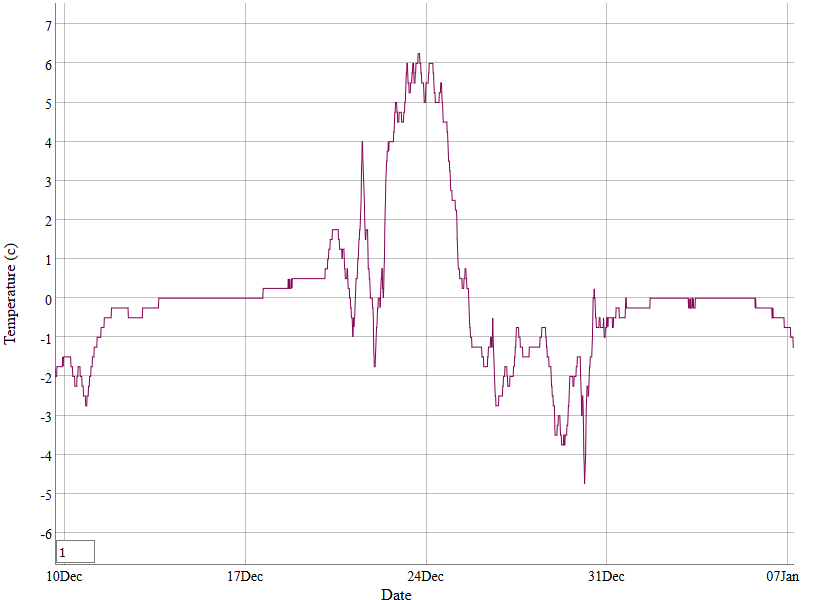
This snapshot of Lochan’s box temperature shows snowy periods – flat-lining – and the sunny period around dec 24th when there was some solar charging (and we can assume the snow was washed off temporarily). The cold events can be seen more clealy towards the end of 2017 and into january 2018.

Snow cover effects

Looking at the incoming data – which is continuous from the Lochan node – I noticed the temperature flatlining since Nov 25th which shows the box is probably in snow now:

This temperature graph shows that the temperature of the lochan node is flat-lining. This normally indicates the box is snow covered and hence thermally insulated.

The battery charge – which was beginning to show signs of reduced solar charging (deeper dips) – also shows a sigificant drop. It is possible the solar panel – which is mounted on the ground – has some snow cover.

This plot shows the normal overnight dips and solar charging cycles becoming deeper. Oce the snow has settled the charge is dropping to around 70%.

Long term sensing

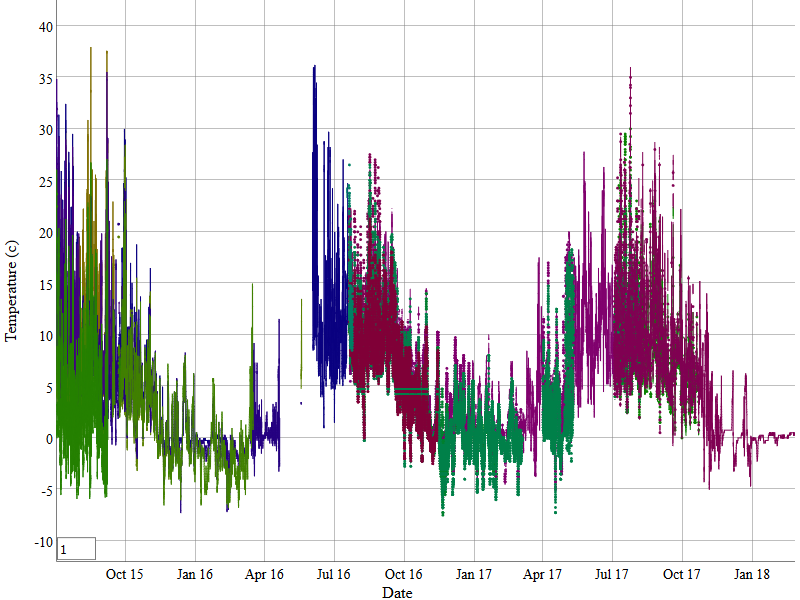
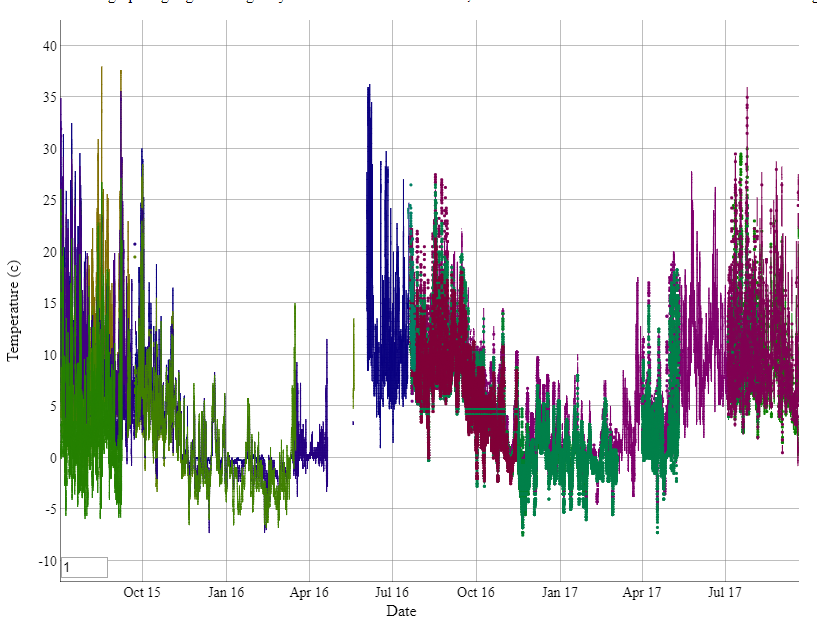
Today’s summary plot shows we have been successful getting data from the mountain over a period of two years. This is the simple on-board temperature but it shows that the network is ready for deployments with more real-world sensors!

This is the long-term plot of temperatures obtained onboard the sensor nodes, It shows that data has been obtained almost continuously since summer 2015.

A look at solar charging

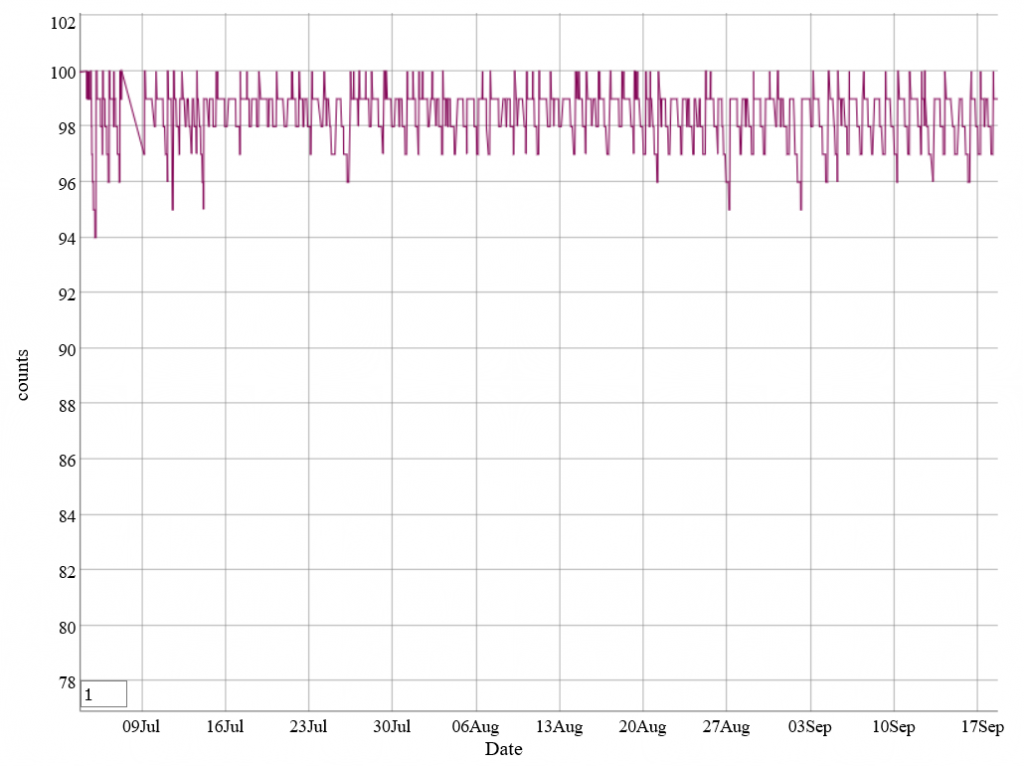
This plot of the state-of-charge for the Lochan node shows that the charging is working very well – with a high average. It will be interesting to see the onset of autumn later.


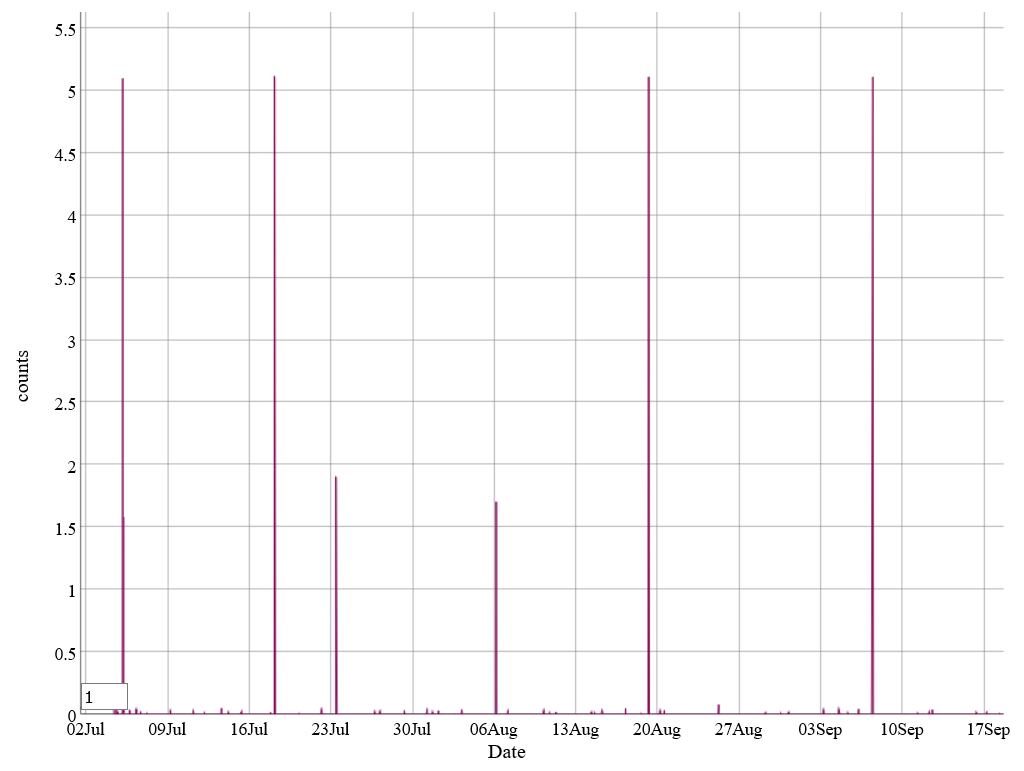
This plot shows battery charge current (count is proportional to mA). The charge controller only charges the battery when it is below a certain level.


zooming into the plot shows daily spikes of charge

Quadcopter imaging

in summer 2017 we imaged several areas to produce Digital Elevation Models (DEM) to investigate their use in repeat surveys. The 3D Robotics Solo was equiped with a Mapir camera:

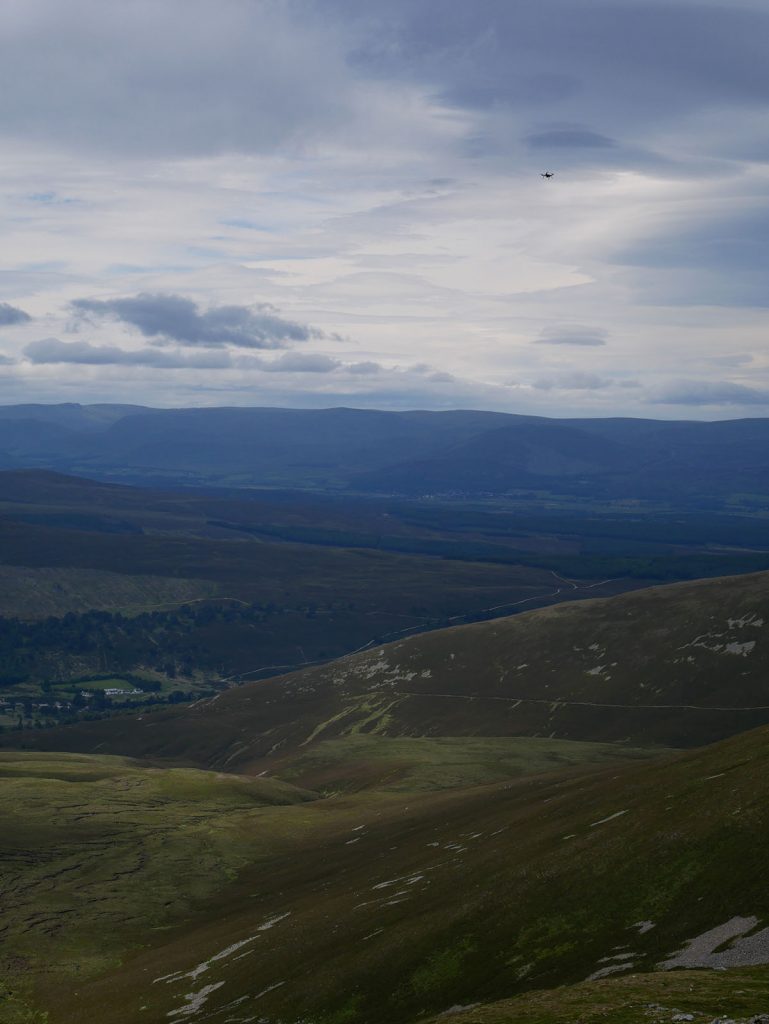
This shows the quadcopter flying an imaging mission (top right in the sky)

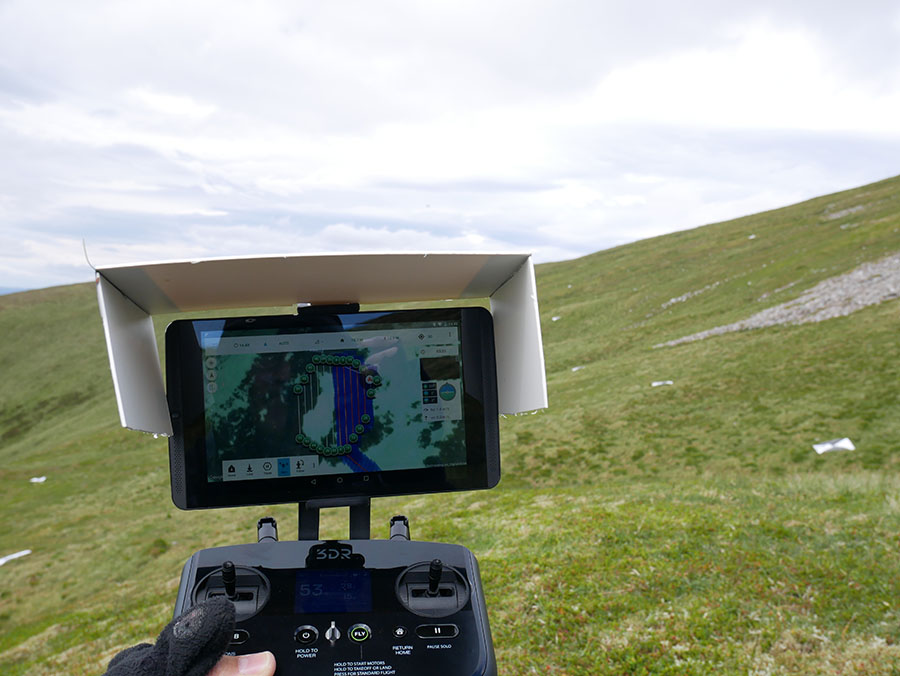
We used the Tower app to control imaging missions

2017 fieldwork

Photos from our visit in 2017

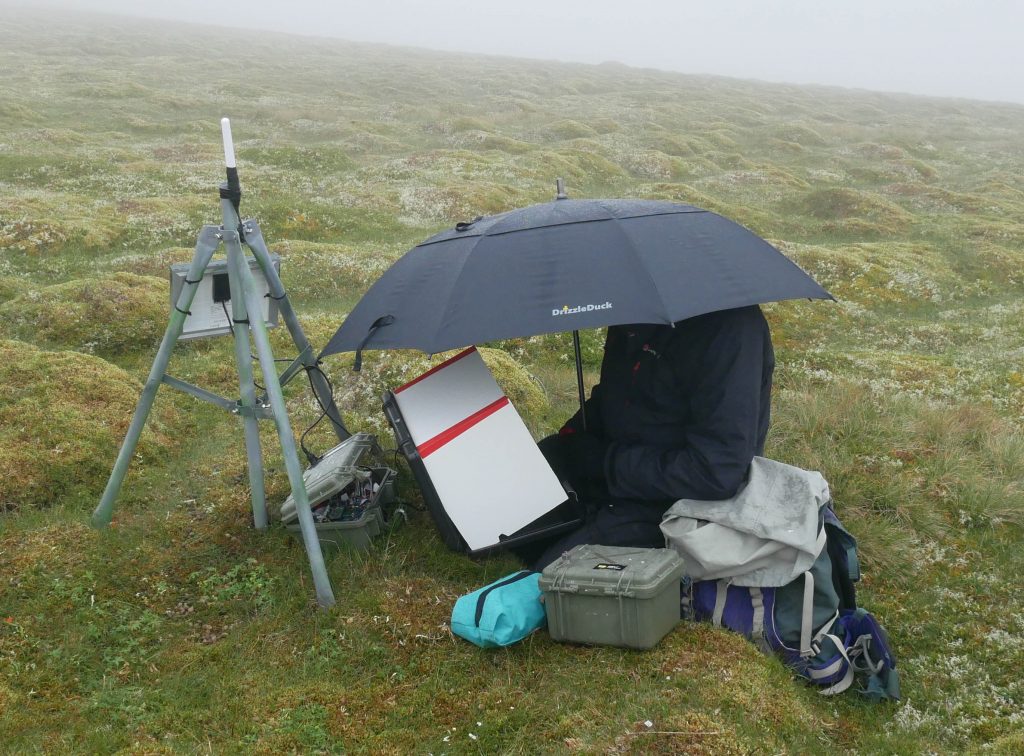
checking the hummock node in the rain – using a large, strong umbrella and adapted Peli case.

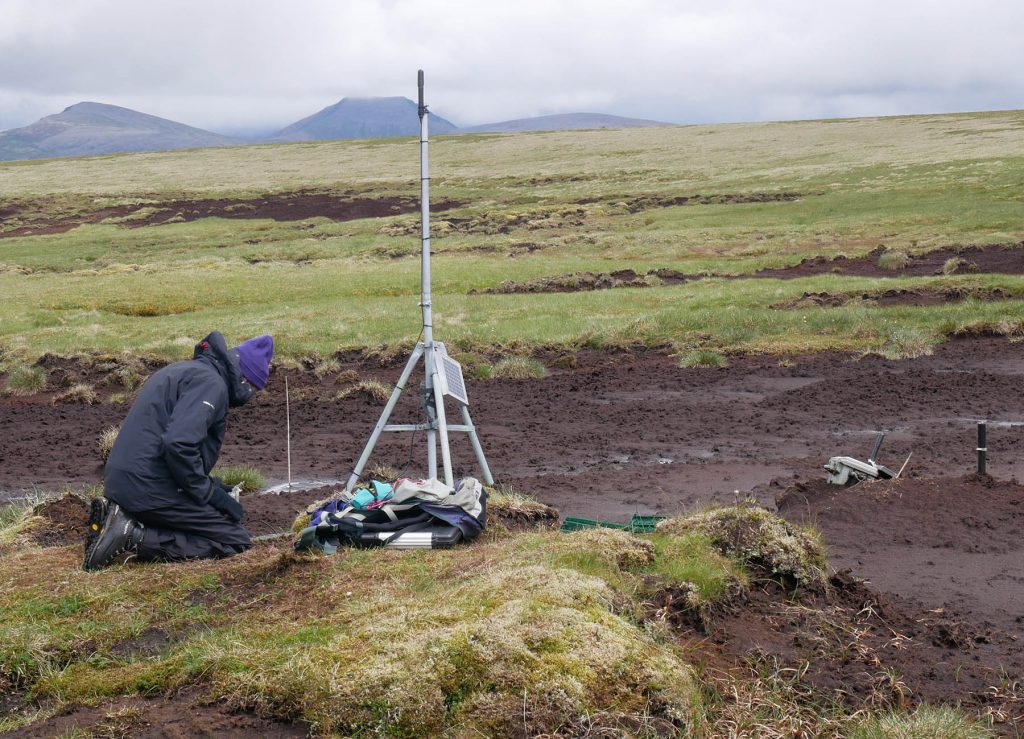
checking the peat nodes in 2017.